OEE
(Overall Equipment
Effectiveness)
Author: Gustavo Velasquez | Date: August 16, 2022
Your factory’s blood pressure, heart rate and oxygen levels monitored in real-time.
An essential part of manufacturing is the ability to quantify the productivity and efficiency of production processes and assets. Everything that can be measured, monitored, and managed can likely be optimized. This, by itself, is already a great reason for implementing OEE-based continuous improvement programs.
OEE is a tremendous benefit to organizations by helping with early detection and providing actionable intelligence to different user bases across the enterprise, whenever availability, performance, or quality aren’t looking as good as they should. OEE is considered a gold standard measurement of how well production lines and assets are running, and this information is critical to determining benchmarks and identifying areas for improvement.
Businesses can monitor and compare the actual effectiveness of production processes and assets and quickly identify issues, allowing troubleshooting and optimizations to resolve the underlying causes of availability, performance, and quality problems.
What is OEE?
OEE (Overall Equipment Effectiveness), in simple terms, is an index that measures how effective any piece of equipment is. You can think of it as a medical monitor that gathers and computes your asset’s blood pressure, heart rate and oxygen levels continuously displaying and keeping the history of these KPIs and raising alerts when things are out of control.
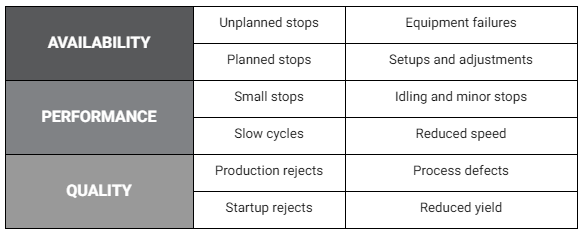
When a well-rounded, integrated OEE system such as 42Q is implemented, operations can quickly unleash the power of clusters of OT information that were previously isolated and very difficult to make sense of. The losses are related to the three main factors that link to poor OEE and can be investigated by any organizational level you desire. The chart below shows the six big losses that manufacturing leaders keep their eyes on for their production lines and processes.
Monitoring and taking action on these metrics is one of the key differentiators between world-class manufacturers and the rest of the pack. Don’t worry, though, help is on the way. If you’re reading this, you’ve already taken the first few steps towards the answer that will help visualize issues and improvement opportunities.
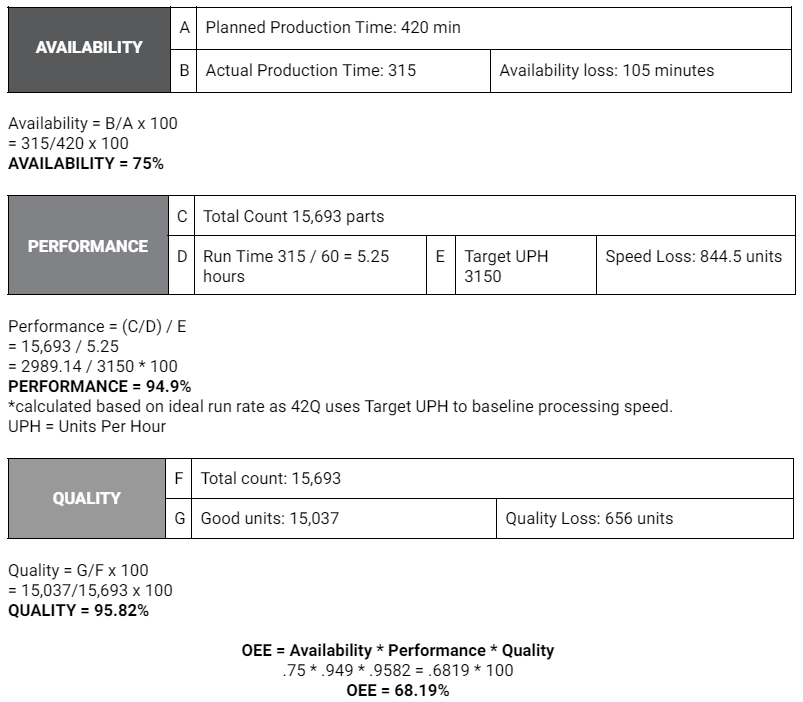
Overall Equipment Effectiveness is the product of the 3 KPIs/metrics above:
OEE = Availability * Performance * Quality
An effective analysis of the underlying causes for losses in any of those 3 main process indicators is a science that requires readily available information; the flexibility to quickly and easily interpret business intelligence and monitoring capabilities while controlling the cost of acquiring all that data, processing it into valuable information and making it available anywhere at any time.
An OEE system that acts in the backstage in a nearly transparent fashion to the operations is the holy grail manufacturers all over the world have been looking for. 42Q can deliver all of that and more.
The OEE components: Availability, Performance, and Quality.
Each underlying variable in OEE corresponds to a specific type of loss. Knowing with confidence that accurate calculations will identify potential production losses, this will in turn will lead to better decision-making, saving time and resources.
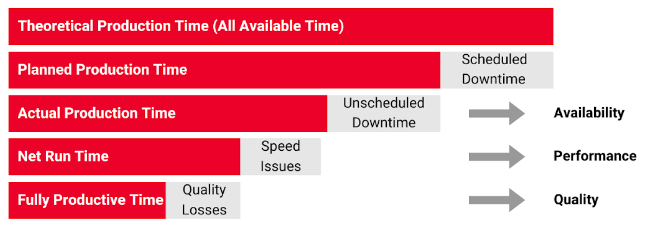
Availability
This KPI compares the time that an asset was operating against the time that it was stopped. It is the relationship between the actual production time (planned production time minus every stoppage, including scheduled and unscheduled downtimes) and the originally planned production time.
Scheduled downtimes are planned events such as personnel breaks, meal times, shift changeovers and other times when production isn’t scheduled to be running. OEE systems should allow for the categorization of downtime events and scheduled downtimes would not be counted as availability loss.
Availability = Actual Production Time / Planned Production Time
Performance
This KPI provides information about how fast a part is being produced. It compares the actual production speed (total count / actual production time) against the theoretical target run rate. Performance is affected by minor stops and slowdowns making production run at less than the ideal cycle time.
Performance = (Total Count / Actual Production Time) / Target Run Rate
Quality
The quality variable shows how many good units were produced versus the total count. It is affected by rejected products. This calculation takes into account good manufactured parts that go through the process for the first time without any rework and divides it by the total number of parts processed.
Quality = Good Units / Total Count
Practical Example
Let’s say that each Friday the operations manager and his team review a weekly OEE trend by manufacturing line or asset.
During their last meeting, they identified the current top five OEE downtime reason codes. The next step was to detect the specific downtime root causes and which machines are experiencing unplanned downtimes due to equipment failure. Afterward, they might want to also drill down even further to find detailed repair information to figure out the most common causes, problems, and repair actions that are resulting in asset downtime.
This type of analysis allows operations management and maintenance teams to make informed decisions and take corrective action to prevent or reduce downtimes. In the upcoming OEE weekly meeting, the team can review the trends and compare them with previous periods (i.e. before and after corrective action plans, supplier changes, staff training, and other potential actions).
The following is a simple example that helps to explain how OEE is calculated:
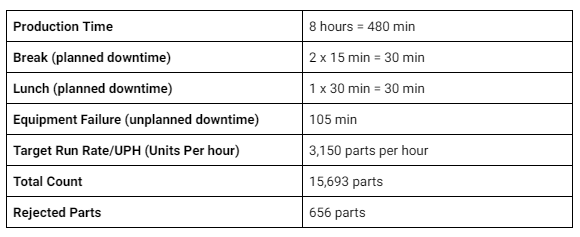
Note: This is fictional data used to explain how OEE calculation may help build the underlying variable(s) that are used to display improvement opportunities.
What can monitoring OEE do for your factory?
- Measure accurately and effectively. Production constraints and bottlenecks can be quickly identified through OEE data analysis, uncovering opportunities to rectify weaknesses thereby improving your processes and machinery. For example, if a production line is capable of producing 100 pieces per hour, but it is producing less than that, OEE systems will point that out.
- Improve Return on Investment (ROI). Assets are expensive. Using them to the fullest can represent an important step towards operational excellence and profitability. OEE provides measurable KPIs that can be used to gauge and monitor efficiency over time, directly supporting decision-making on maintenance plans, material supply processes, staff training, machine purchases, and more.
- Cost savings. By utilizing OEE and analyzing the underlying metrics, teams can identify losses and work on minimizing defective products, and reworks machine slowdowns, and unplanned downtimes, which translates into cost savings.
- Predict/Prevent breakdowns. As OEE provides real-time machinery efficiency information, it helps companies to prevent or control machine failures. This could lead to less unscheduled downtimes, especially when it is integrated with a Computerized Maintenance Management System (CMMS) that calculates the mean time between failures (MTBF) and mean time to repair (MTTR).
OEE in 42Q
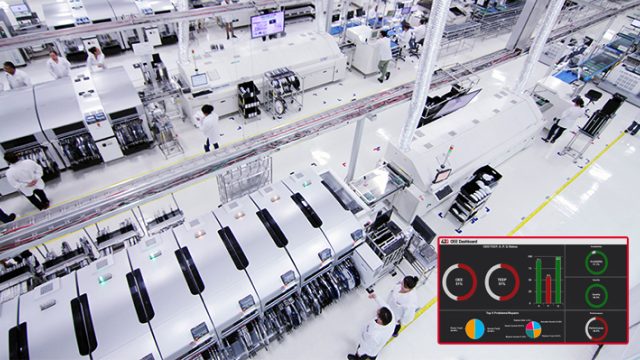
The set of functionality provided by 42Q’s OEE system includes several features around data collection, analysis, and reporting through a clear and intuitive user interface. Additionally, it is easy to implement machine connectivity through 42Q’s IIoT modules.
![]()
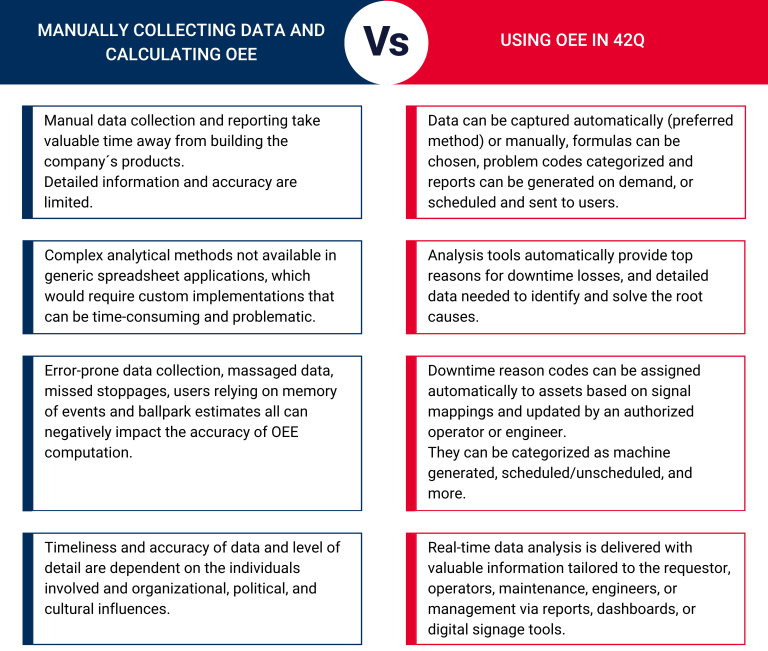
The benefits of an automated data collection
42Q’s OEE system allows manual or automatic data collection and interpretation. Although automated data collection might require some larger initial effort, it is a much more powerful and less error-prone strategy delivering more accurate and consistent information.
In the following table, you will find a comparison of computing OEE manually yourself versus using 42Q’s MES.